 When you select data points you can change the markers.
Markers have a size, a border, and can be filled, several marker types are
available.
When you select data points you can change the markers.
Markers have a size, a border, and can be filled, several marker types are
available.Each point on a scatterplot is, by default, shown as a small circle.
If you specify a marker variable, e.g. continents in a country data set, a different
colour will be used for each of the continents.


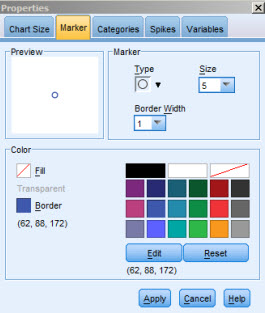
When you select data points you can change the markers.
Markers have a size, a border, and can be filled, several marker types are
available.
 Marker types:
 All markers can be changed at the same time, but you can as well select individual points and change its marker to highlight a particular
case of interest, select several points or, as shown to the left, use the lasso tool to select a group and then modify the selected
case markers.
All markers can be changed at the same time, but you can as well select individual points and change its marker to highlight a particular
case of interest, select several points or, as shown to the left, use the lasso tool to select a group and then modify the selected
case markers.