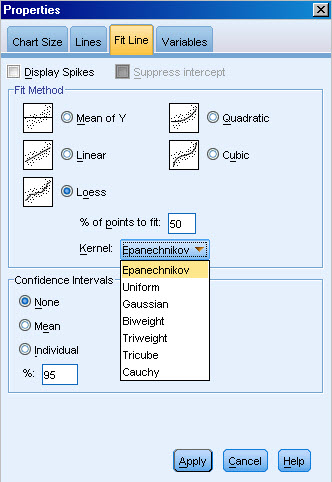
 LOESS is available from the Fit Line
tab of the Properties panel
when you edit a scatterplot in the chart editor.
- Produce a scatter plot:
menu.
- Select any option you like.
- Double-click the scatterplot to open it in the chart editor.
- Select
or possibly
.
- Check Loess: you can change
default size of the smoothing window (expressed in % of the
observations (neighborhood size of the slices) and you migth
also change the default "kernel method", i.e the way the
smooth values are computed: the options are in fact
different weighting schemes. Uniform gives the same weight
to all values, other options weight observations towards the
edge of the window less.
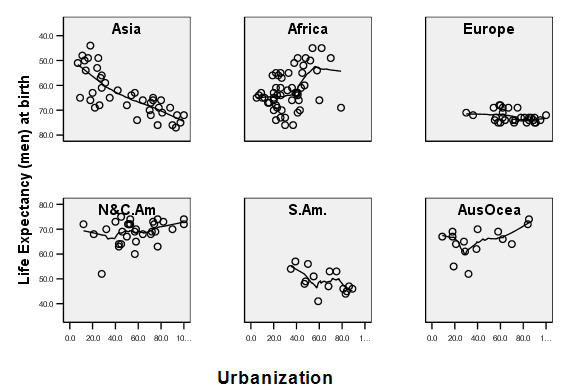
Below you will find an example: with a loess curve added to a plot for each continent.

 LOESS is available from the Fit Line
tab of the Properties panel
when you edit a scatterplot in the chart editor.
 LOESS is available from the Fit Line
tab of the Properties panel
when you edit a scatterplot in the chart editor.