Box-and-whisker plots (Boxplots)
The
menu [GRAPH command] produces several forms of boxplots.
 When producing boxplots with the
menu, select your options
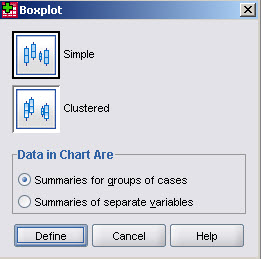
carefully as the procedure lets you create either single or clustered boxplots for
either summaries of groups of cases or for separate variables. You can obtain:
When producing boxplots with the
menu, select your options
carefully as the procedure lets you create either single or clustered boxplots for
either summaries of groups of cases or for separate variables. You can obtain:
- Boxplots picturing single variables
- Boxplots picturing groups of a single variable (e.g. continents) (groupwise
boxplots); specify a categorical variable (factor variable) defining the groups
(specify a variable for the Category axis)
- Boxplots letting you compare several distinct variables on a common scale (parallel boxplots)
- With all forms you can request
panels of boxplots , i.e.. create individual boxplot for each category of a panel variable.

Here's an example of a specific boxplot dialog, producing a chart that pictures groups
of a single variable.
Remarks
- With all command forms: you should, whenever available, specify,
a case identification variable (Label Cases By),
e.g. the country names so SPSS can label outliers etc.
(By default SPSS will use case numbers).
- Depending upon the selection you made, the dialog that lets you specify
variables and options is different for each form of boxplot.
See also