 After opening the Chart Builder ()
select
Scatter/Dot from the
Gallery.
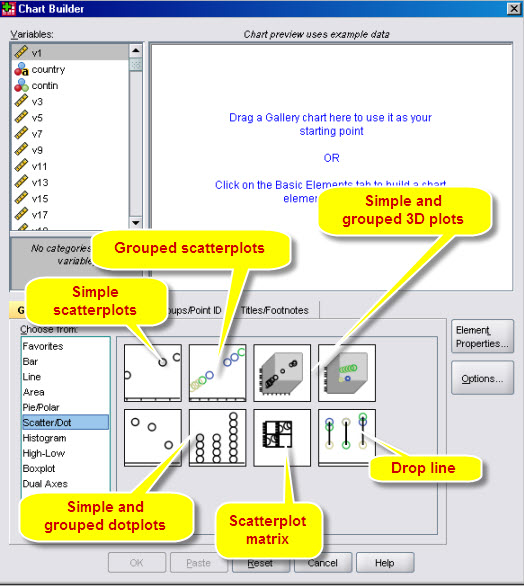
Various forms of scatterplots can be produced by dropping one of the icons
onto the Preview Area ("Canvas").
After opening the Chart Builder ()
select
Scatter/Dot from the
Gallery.
Various forms of scatterplots can be produced by dropping one of the icons
onto the Preview Area ("Canvas").This document explains how to produce scatterplots using the SPSS Chart Builder
After opening the Chart Builder ()
select
Scatter/Dot from the
Gallery.
Various forms of scatterplots can be produced by dropping one of the icons
onto the Preview Area ("Canvas").
The various forms are labelled on the screenshot. Grouped scatterplots designate a scatterplot where groupes are differentiated (e.g. continents) using distinctive markers.
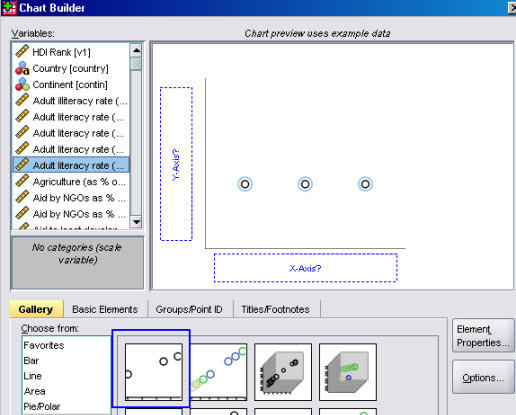 When selecting a simple scatterplot,
you only need to provide an X and a Y variable.
When selecting a simple scatterplot,
you only need to provide an X and a Y variable.
 If you select Groups/Point Id
tab you should check Point ID Label
and drop an case identification variable into the appropriate spot (e.g. country names) to be able to identify
individual observations (see below for details).
If you select Groups/Point Id
tab you should check Point ID Label
and drop an case identification variable into the appropriate spot (e.g. country names) to be able to identify
individual observations (see below for details).
On the same panel you can choose to
After having produced the graph, you can interact with it and add elements or change various aspects of the graph by invoking the (invoked by double-clicking the chart in the ). A number of scatterplot specific aspects are documented here: