By default a barchart for categorical variables shows bars proportional to the number of observations (counts) in each category. Frequently you will prefer percentages to make comparisons easier. This is no problem if you have only one categorical variable pictured, however if you have more than one variable shown in bars there are several ways to compute percentages. This document shows the various possibilities.

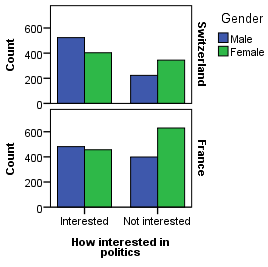
Let us take a simple example: A barchart showing political interest by gender by country. The barchart here shows numbers of cases in each category.
 Summary of group of cases gives you only
two choices: counts or % of cases and the percentages are computer for each panel total, i.e. the four bars for Switzerland add up to 100%; there is no possibility to
have percentages based only on those who are interested.
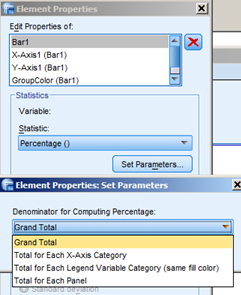
 With the you have many more possibilites; on the
Element properties panel, Statistics section several possibilites are offered. Below you will find a crosstabulatio that
corresponds to our example and show the percentages shown in the corresponding barchart.
